Transparency platform
Monitoreo de Planilla
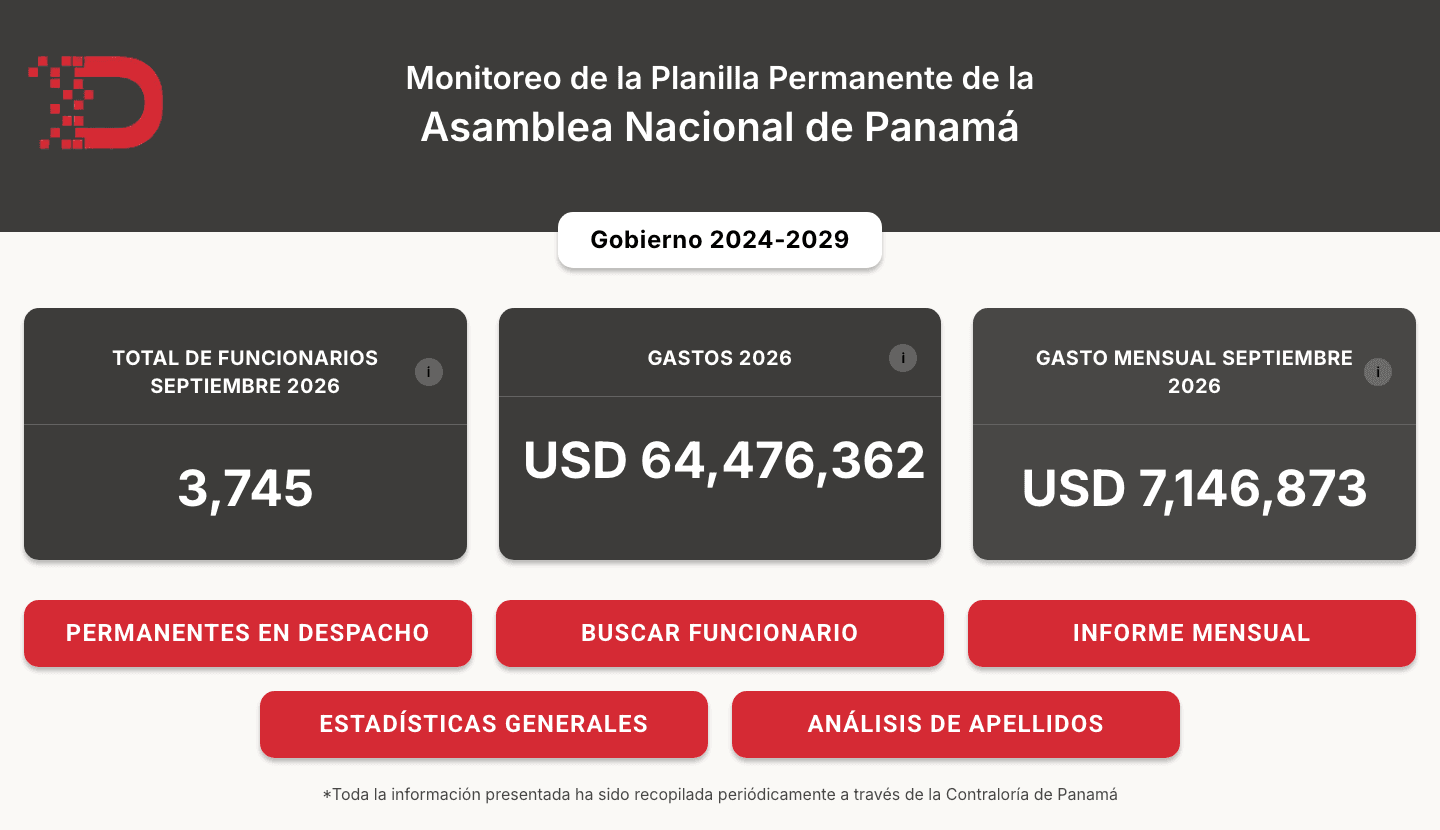
A public tool for exploring the permanent payroll of Panama's National Assembly: who works there, what they earn, and how that changes with every new payroll. We built it, and we keep its data up to date.
- What we did
- Design, development, data collection and ongoing maintenance
- Year
- 2026
- Built with
- Next.js
- TypeScript
- Tailwind CSS
- Recharts
- TanStack Query
- FastAPI
- Python
- Pandas
- SQLite
01The challenge
The Assembly's payroll is public, but it's published as dense monthly spreadsheets. Reading one is hard, and comparing them over time is harder, so the data wasn't reaching the citizens and journalists it's meant for.
02What we built
Working with experts in data management and open parliament, we built a platform that turns each payroll into charts, tables and statistics that anyone can explore.
Home
Total staff, yearly spending and monthly spending from the latest payroll.
Permanent staff by office
Staff tied to each deputy's office, including those moved between payrolls.
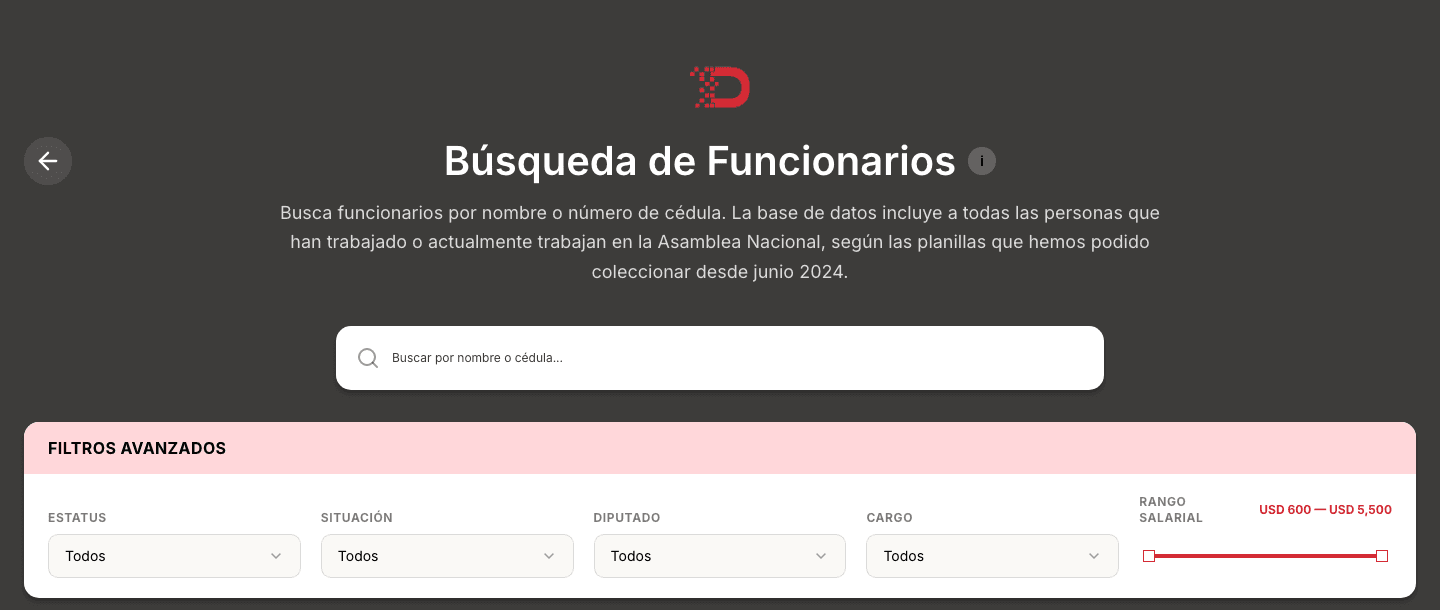
Staff search
By name or ID number, with filters and a history of hires and departures.
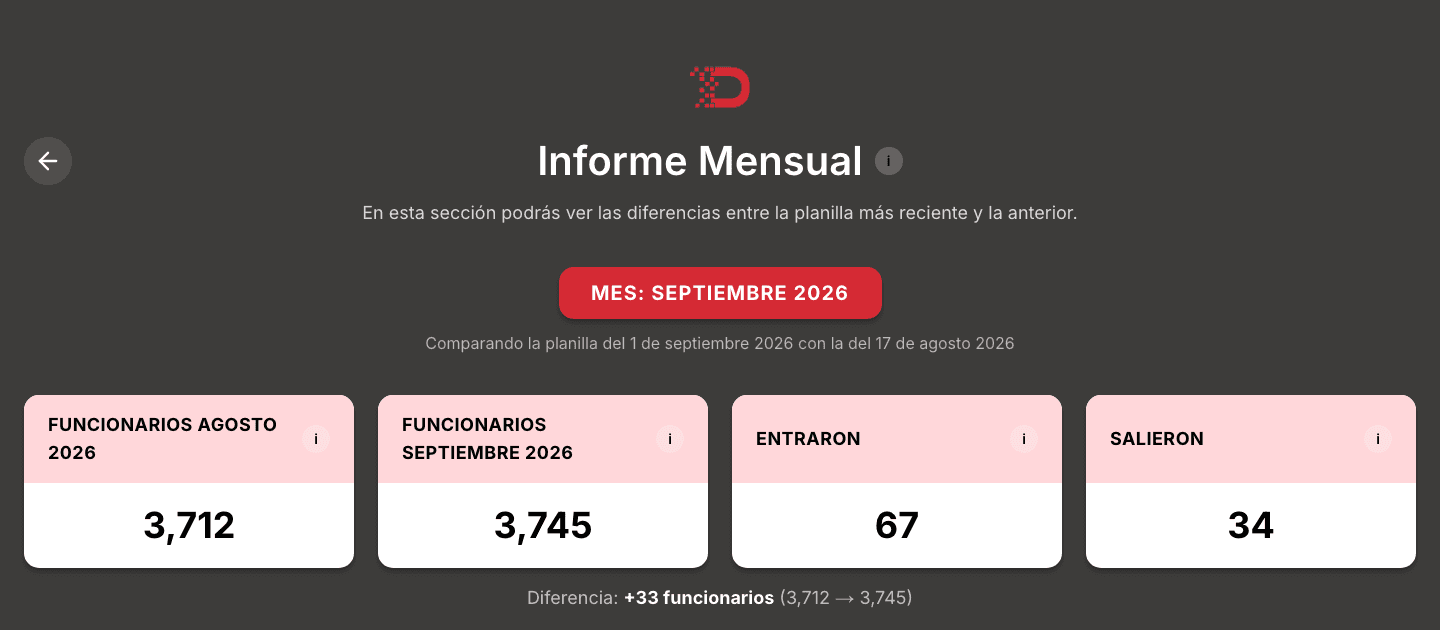
Monthly report
Who joined and who left between two payrolls, and what it cost.
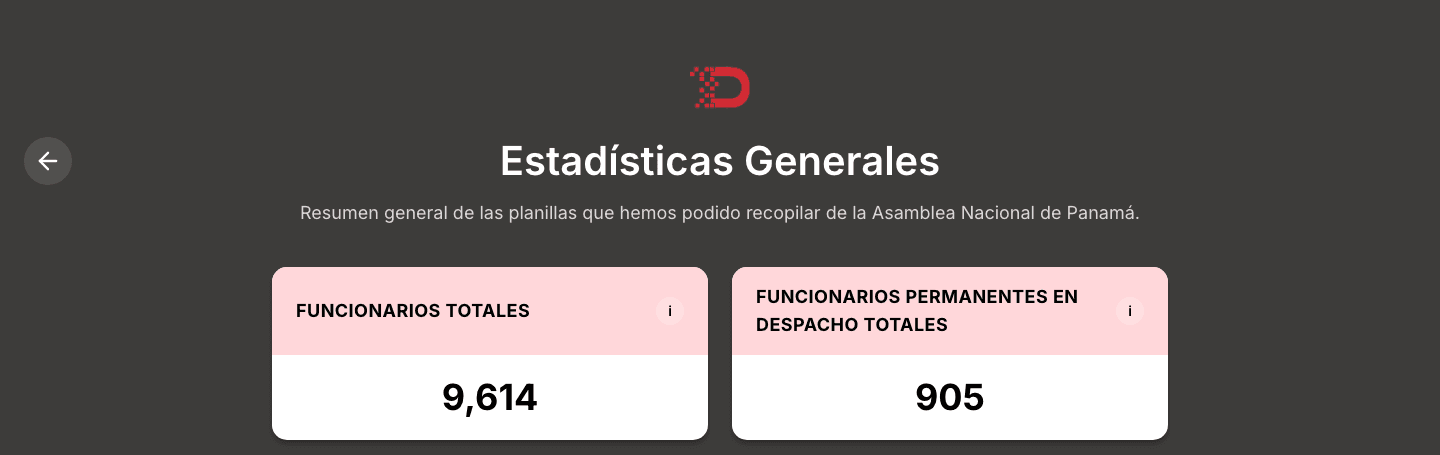
General statistics
Totals, parties, trends, salaries, tenure and salary ranges.
Surname analysis
Common surnames, within each office and shared with the deputy.
20+ payrolls collected since June 2024, and counting.
03The data
Behind the dashboards is a dataset we built and keep ourselves. Since June 2024 we've collected every permanent payroll the Contraloría publishes: 20+ payrolls so far.
Each one is cleaned and joined into a single master table that follows every person across payrolls, so the site can show when someone was hired, when they left and whether they moved between offices. We cross-reference it with deputies' office assignments and with each deputy's party and circuit.
04Kept up to date
Monitoreo isn't a one-off launch. We manage the platform and update it with every new payroll: we add it to the dataset, recalculate every statistic, review the results and publish.
That way the numbers on the site always reflect the latest payroll, and the history keeps growing month after month.
05Every number explained
Each figure has an “i” that explains what it shows and how it was calculated, using the real numbers from the backend. The goal was a tool people could trust, not just a set of charts.